
See Better with Daniel Inside

Ryan: “Friday was one of our highest-revenue days. We had the customers, we had the demand. But were we capturing every opportunity?”
Ryan is part of the leadership team at a national supermarket chain.
For months, the business had been looking for ways to improve revenue across its stores. Friday was consistently one of its strongest days, with customers preparing for the weekend and demand for certain products increasing.
But Ryan believed there was still room to grow.
Were the promotions not strong enough? Were popular products running out too quickly? Or did the stores need to improve how they served customers during peak hours?
Adam from Operations and Hana, one of the Store Leaders, had their own hypotheses. They reviewed staffing schedules, product availability, and store performance, then tested improvements based on what they knew about the business.
Some worked. But the team still couldn’t see the full picture.
The reports weren’t wrong. Neither were the teams.
There was simply something else in the data they hadn’t seen yet.
You haven’t discovered the non-obvious patterns as yet.
Most businesses are not short on reports. Operations has staffing schedules and store performance. Leadership has revenue dashboards. Customer transactions, store traffic, product availability, purchase frequency, and more may already be there.
The challenge is how much of it a person can realistically investigate.
When we analyze data, we naturally start with the patterns and relationships we already know. We compare metrics we believe are connected, test hypotheses based on our experience, and investigate where we expect to find an answer.
But that also makes completely new connections harder to spot. Across all that data, there may be millions of relationships we simply haven’t looked into.
This is where Daniel becomes part of the revenue-driving flywheel.
One revenue-driving flywheel, powered by Daniel
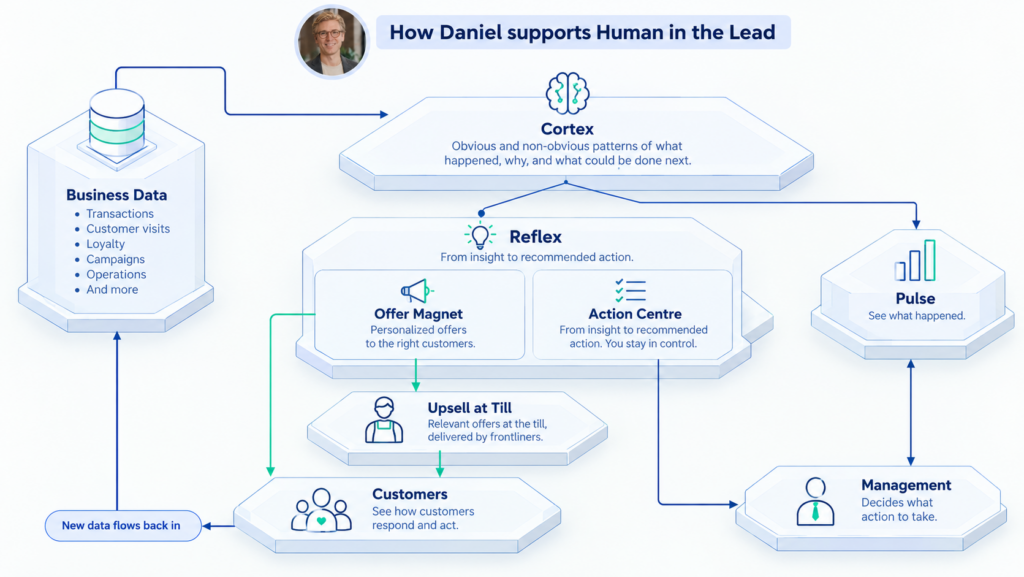
Daniel is AISensum’s AI teammate, designed to connect business data, insights, human decisions, and customer action in one continuous learning flywheel.
Seeing better with Daniel inside is where that flywheel begins.
Business and customer data flow into Cortex, where obvious and non-obvious patterns can be explored. Pulse helps teams see what is happening in the business, while Reflex can turn insights into recommended actions.
From there, people decide what happens next.
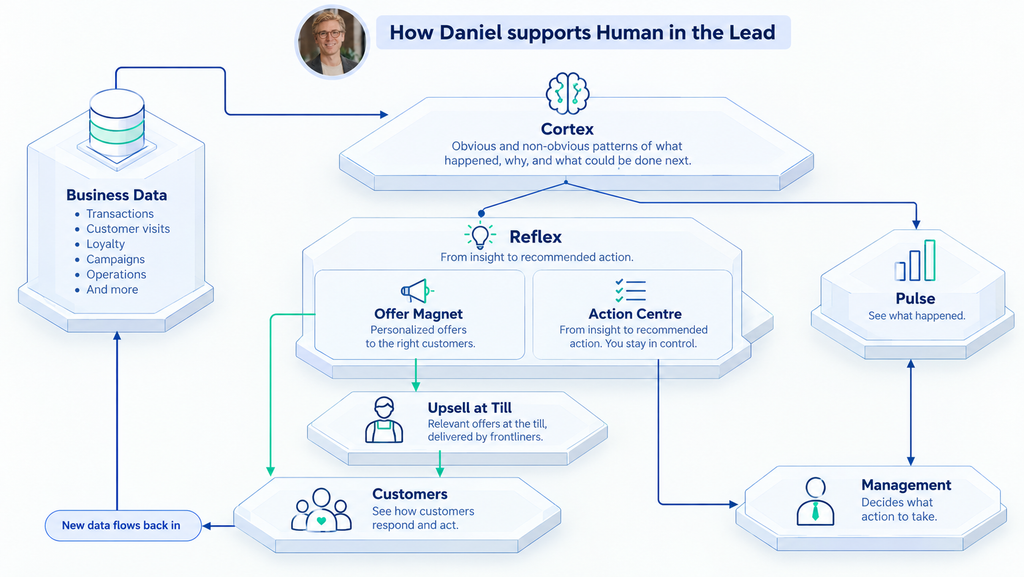
For Ryan, it starts with Cortex exploring the relationships behind the supermarket’s Friday performance.
Cortex finds the obvious and non-obvious patterns that are goldmines.
Ryan’s supermarket already had the data it needed.
Cortex explored millions of possible connections and relationships across that data, from the obvious to the non-obvious. It examined which variables moved together, which didn’t, and whether those patterns held over time.
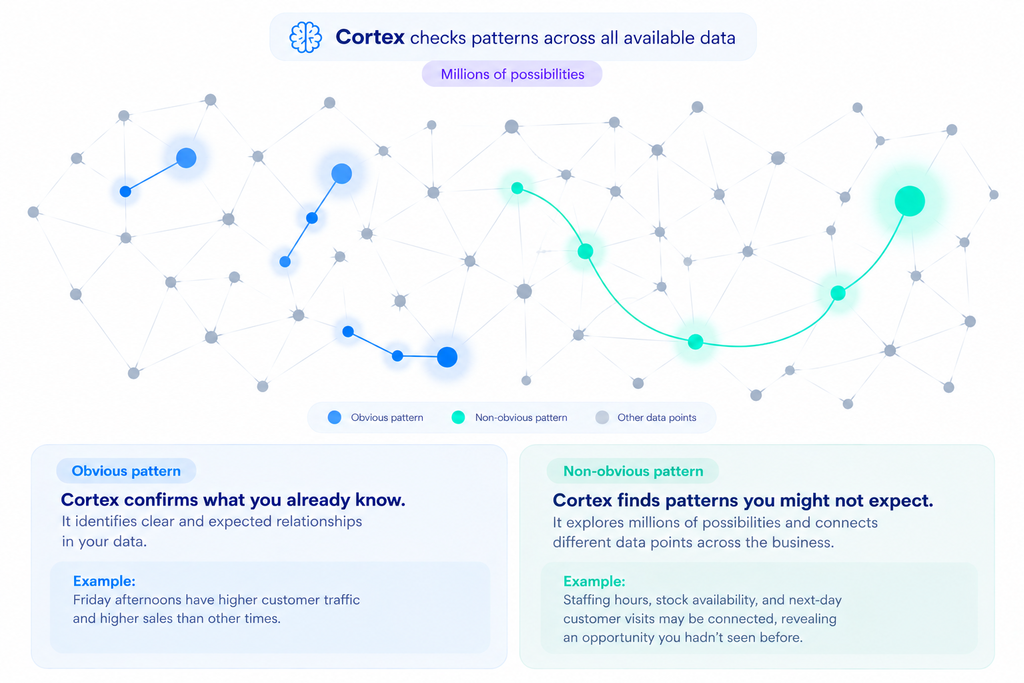
Some confirmed what the team already knew: Friday was one of the highest-revenue days. Customer demand increased heading into the weekend, particularly for products associated with weekend activities.
But Cortex also identified something else.
Friday afternoons regularly had fewer staffing hours than the expected requirement. Meanwhile, Sundays and Tuesdays had more staffing hours than needed.
That was already an interesting operational finding, but Cortex explored further.
Historical data showed that during similar periods, Friday evenings with staffing shortfalls also experienced unusually high out-of-stock rates. And customers who encountered unavailable products were less likely to return the following day.
Staffing allocation, product availability, and customer return behavior appeared to be connected.
Individually, these metrics were already available. Operations could review staffing hours. Store Leaders could monitor stock availability. Leadership could track sales and customer visits.
But the relationship between them wasn’t being investigated together.
The question was no longer simply how to increase demand on Friday.
It was whether the supermarket could capture more of the demand it already had by changing how its existing resources were allocated.
The data was already there. The relationship wasn’t being looked at.
Cortex finds the pattern. Your team decides the next action.
Finding a pattern is not the same as making a business decision.
Cortex can surface relationships, examine whether they persist over time, and identify opportunities worth investigating.
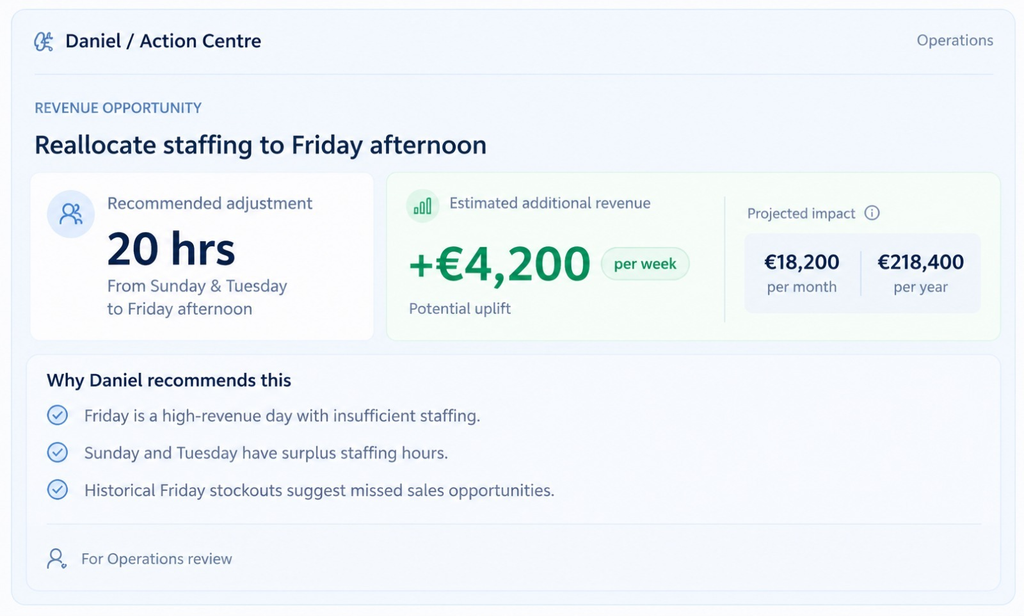
In Ryan’s case, it surfaced a possible action: reallocate 20 staffing hours from Sunday and Tuesday to Friday afternoon, with an estimated opportunity of €4,200 in additional weekly revenue.
The potential impact adds up over time. If that improvement is sustained, it could translate into approximately €18,200 per month, or €218,400 in additional revenue over a year.
That’s the bigger opportunity: a change in how existing resources are allocated could create meaningful business impact without necessarily increasing staffing hours.
But a recommendation is not a decision.
Adam understands staffing requirements, employee availability, and how store operations actually work. Hana knows what happens on the shop floor, including replenishment needs and customer service during busy periods. Ryan understands the broader commercial targets.
Together, they can ask better questions.
Would reallocating those hours affect service on other days? Is the pattern consistent across stores? Could better Friday coverage help reduce stockouts? And how should they test whether the change actually improves revenue?
Cortex gives them a stronger starting point, but the team still decides what makes sense.
A human analyst could have discovered the same relationships. The limitation isn’t capability. It’s capacity.
Among millions of possibilities, Daniel finds the powerful patterns, and your team makes the relevant decisions.
This is what we call Human in the Lead.
AI can explore millions of possibilities. People bring the experience and context to understand which ones matter.
Leads AISensum's content strategy, social footprint, and partnerships, using research and storytelling to translate the "Human in the Lead" framework into campaigns that make AI teammates real to enterprise audiences.